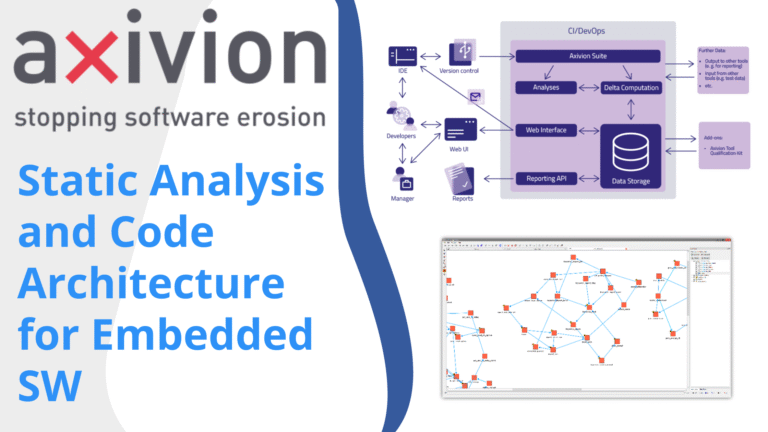
Axivion Introduction: A Comprehensive Guide to Static Analysis and Architecture Checks
If you are involved in embedded software development or testing, you're likely aware of the challenges in maintaining code quality, ensuring compliance, and managing architectural integrity. Axivion, a powerful static analysis tool, offers a robust solution to these challenges. This guide walks you through the essentials of Axivion—how to set it up, use its dashboard, interpret various analysis results, and define architectural rules that help keep your projects clean and maintainable.
This article is inspired by the expertise shared by Eyal Gerber from Novodes Embedded Software Experts, who provides an insightful demonstration of Axivion’s capabilities in real-world embedded projects. The goal here is to equip you with a clear understanding of how Axivion can elevate your software quality assurance processes.
Table of Contents
- Getting Started with Axivion: Setting Up Your Project
- Exploring the Axivion Dashboard: Your Command Center for Code Quality
- Running the Analysis: How to Get Your Project’s Health Report
- Understanding the Types of Issues Found by Axivion
- Configuring Coding Standards and Exclusions
- Defining and Enforcing Architecture Rules with Gravis
- Tracking Progress Over Time
- Why Choose Axivion for Your Embedded Software Projects?
- Conclusion
Getting Started with Axivion: Setting Up Your Project
One of the first hurdles when adopting a new tool is configuration. Fortunately, Axivion makes setting up a new project straightforward and intuitive. The tool supports multiple IDEs, including popular platforms like Keil uVision, IAR, and others, making it versatile for embedded software developers.
Step-by-Step Project Setup
Begin by accessing the project configuration area, where you’ll find a new project wizard. This wizard guides you through the setup process, reducing complexity and minimizing setup errors.
- Server Configuration: Axivion stores all analysis results on a server, which then uploads data to a browser-based dashboard. You can configure this server to run on a local machine or across a network, depending on your infrastructure. For individual developers or small teams, running the server on the same machine as the analysis is simple and effective.
- Project Folder Selection: Choose the folder where your source code resides. This helps Axivion know exactly which files to analyze.
- Build System Selection: Select the build system your project uses. For example, if you are using Keil uVision, choose that option. Axivion automatically detects the compiler toolchain, which further streamlines the process.
- Project and Target Selection: Point Axivion to your project file and specify the target build configuration. This includes identifying the binary file (e.g., .bin) that is generated for your embedded target.
- Compiler Command Line: Copy the compiler command line from your IDE into Axivion. This ensures that the analysis mimics your actual compilation environment, leading to more accurate results.
- Version Control Detection: Axivion automatically detects your version control system (e.g., Git), which helps in associating code changes with analysis results.
- Dashboard URL Setup: Define the URL or path where the dashboard will be accessible, typically localhost with a specified port.
This guided setup is designed to work out-of-the-box for most projects. If you encounter any difficulties, support is readily available to assist you in fine-tuning your setup.
Exploring the Axivion Dashboard: Your Command Center for Code Quality
Once your project is configured and the analysis has run, Axivion presents results via a browser-based dashboard. This dashboard is the heart of your static analysis workflow, providing a comprehensive overview of your code’s health and trends over time.
Dashboard Features
- Results Overview: View the total number of errors detected, categorized by type. For example, you might start with 60,000 errors but reduce this to 20,000 by excluding third-party files that are irrelevant to your codebase.
- Timeline of Analysis Runs: Track how your code quality changes over time. The dashboard provides a timeline showing whether issues have increased or decreased, helping you measure the impact of your fixes and improvements.
- Issue Filtering: Filter issues based on severity levels such as required, advisory, or informational. This helps prioritize fixes effectively, especially when adhering to strict industry standards.
- Issue Details: Drill down into specific issues with detailed descriptions, location in the code, and even the owning developer or committer responsible for changes.
This intuitive dashboard not only highlights problems but also empowers you to make informed decisions on what to address first, improving your code quality iteratively.
Running the Analysis: How to Get Your Project’s Health Report
After you have configured your project, running the Axivion analysis is simple. Typically, a start_analysis.bat file is created, containing all the necessary commands and parameters to launch the analysis. Running this script initiates a thorough static check of your entire project.
The analysis process automatically extracts build steps from your project files (e.g., Keil uVision) and runs them through Axivion’s static analysis engine. Depending on project size, this can take several minutes, but the results are well worth the wait.
Once complete, you can open the dashboard to review the findings. The dashboard will display your project and any others you might be analyzing, allowing you to select the relevant project to examine detailed results.
Understanding the Types of Issues Found by Axivion
Axivion categorizes detected problems into several key types, each providing unique insights into your code quality and maintainability. Here’s a breakdown of the most important categories:
Code Clones
Duplicate code fragments, or clones, are a common source of maintenance headaches. Axivion identifies both exact and near-duplicate code snippets, even when variable or class names differ.
For example, Axivion can detect when two functions across different files share an almost identical structure but differ only in naming conventions. This visibility allows you to refactor and consolidate code, reducing redundancy and potential bugs.
By clicking on a clone issue, you can see the exact locations in your project where the duplicated code exists, along with commit information about who introduced it.
Cycles in Code
Cycles occur when modules or files reference each other in a circular manner, which can lead to tight coupling and complex dependencies. Axivion detects these cycles and visually represents them, showing the chain of function calls or references that create the cycle.
For instance, a cycle might involve a header file calling a function that, through several layers, calls back to the original module. While some cycles might be intentional, many are problematic and worth investigating.
Dead Code
Dead code refers to routines, macros, or variables that are never accessed or called. Axivion flags these parts so you can evaluate whether to remove them, which helps reduce code bloat and potential confusion.
Identifying dead code is especially critical in embedded systems where memory and resource constraints are tight.
Metric Violations
Metrics such as cyclomatic complexity are crucial indicators of code maintainability. Axivion analyzes these metrics and flags functions or modules that exceed defined thresholds.
For example, a large function responsible for 'warm start' in a logging engine might be flagged for excessive complexity, signaling the need to simplify or refactor.
Style Violations
Axivion also checks for adherence to coding standards, such as MISRA or AUTOSAR C++. Style violations are often the most numerous and include issues like improper macro definitions or non-compliant naming conventions.
Each violation is accompanied by detailed explanations, references to the standard, and exact code locations, making it easier to understand and fix.
Configuring Coding Standards and Exclusions
You can customize Axivion to check against different coding standards, such as MISRA versions from 2012, 2019, or 2023, AUTOSAR, or specific C++ standards. This flexibility allows you to tailor the analysis to your project's compliance requirements.
If some parts of your project should be excluded—like unit test files or third-party libraries—you can specify global exclusions. This ensures that your analysis remains focused and relevant.
Defining and Enforcing Architecture Rules with Gravis
One of Axivion’s standout features is its ability to analyze and enforce architectural rules using a companion tool called Gravis. This tool helps you visualize your project's architecture and define allowed dependencies between layers.
How Gravis Works
After running an analysis, you can download an RFG file containing detailed information about your code’s declaration facts—essentially, all the connections between files and modules.
Gravis allows you to create layers representing different parts of your system, such as:
- Application Layer
- Drivers Layer
- CPU Hardware Initialization Layer
- Middleware
- RTOS
You then map your project folders and files to these layers, defining an ideal architecture for your project.
Setting Layer Relationships
Next, you specify which layers are allowed to reference or call which others. For example, your application layer might be allowed to call drivers, but drivers should not reference the application layer. These rules help maintain a clean, hierarchical architecture and prevent unwanted dependencies.
Analyzing Architecture Violations
Once these rules are defined, Axivion can detect violations during analysis runs. Violations are visually marked in red, while conforming elements are green. You can drill down from layers to folders, files, and even specific functions to pinpoint the exact source of architectural breaches.
For example, you might find that a driver file is referencing an application-level class, which violates your defined architecture. Axivion will show you the exact file and location, along with detailed explanations.
Tracking Progress Over Time
Maintaining code quality is an ongoing effort, and Axivion supports this by providing trends and comparisons between different analysis runs.
- Issue Trends: For each type of issue—be it architecture violations, clones, or style errors—you can see how the number of problems evolves over time.
- Comparing Versions: Axivion allows you to compare two analysis snapshots from different dates. This comparison highlights the number of issues added, removed, or unchanged, giving you clear feedback on your development progress.
For example, after cleaning up your project by excluding irrelevant files, you might see a significant drop in reported issues. Subsequent development might add some new issues but also remove more, showing a net improvement.
Why Choose Axivion for Your Embedded Software Projects?
Axivion stands out as a comprehensive static analysis and architecture checking tool tailored for embedded software developers. Here’s why it’s worth considering:
- Ease of Setup: The intuitive wizard and automatic detection of build systems and version control make starting with Axivion hassle-free.
- Comprehensive Analysis: From code clones to dead code, metric violations to style compliance, Axivion covers all bases.
- Architecture Enforcement: With Gravis, you can define your system's architecture and automatically detect violations to maintain clean layering.
- Trend Monitoring: Track your progress over time and compare different versions to ensure continuous improvement.
- Customization: Adapt the tool to your coding standards and exclude irrelevant files to keep the analysis focused.
By integrating Axivion into your development workflow, you gain powerful insights that help you reduce technical debt, improve code quality, and maintain architectural integrity.
Conclusion
Static analysis tools are indispensable in today’s complex embedded software development landscape, and Axivion offers a rich set of features designed to meet these demands. From a simple and guided setup to deep architectural analysis and comprehensive issue tracking, Axivion empowers you to keep your codebase clean, compliant, and maintainable.
Whether you are a solo developer or part of a larger team, leveraging Axivion’s capabilities can significantly improve your software quality assurance processes. Take the time to explore its dashboard, understand the types of issues it detects, and define architectural rules that reflect your project’s ideal structure.
With Axivion, you don’t just find problems—you gain actionable insights that help you build better embedded software, faster and with confidence.